
Table of Contents
Perturbation effect
The mechanistic model implemented in HiPathia can also be used for the simulation of the effect that interventions, such as gene knock-out and over-expression perturbations, can have over signaling pathways. This simulation is carried out by changing the expression level of the gene(s) of interest, recalculating the resulting signaling profile in the simulated condition and comparing it to the original profile. Similarly, the effect of inhibitory or agonistic drugs can be simulated by decreasing or increasing the expression level of the target gene. This module of analysis brings the functionality of the PathAct algorithm to the HiPathia application.
Gene perturbations can be studied one at a time or simultaneously in combinations. In this way it is possible to check for the potential effect of drug combinations over the activity of signaling pathways in a given condition.
In this module, the effects of interventions over one specific condition (defined by the profile of gene expression of the sample) can be studied in an interactive manner. Thus, after uploading the gene expression profile of a sample, a pannel appears in which different genes can be selected and the typpe of interaction can be chosen by simulating an increase or decrease in their gene expressio levels in the sample. Alternatively, the effect of drugs (taken from DrugBank) can be explored. The genes targeted by the selected drugs are set to the corresponding simulated state of activation or inhibition.
The Perturbation effect module can be accessed from the main menu bar, by clicking on the Perturbation effect button.
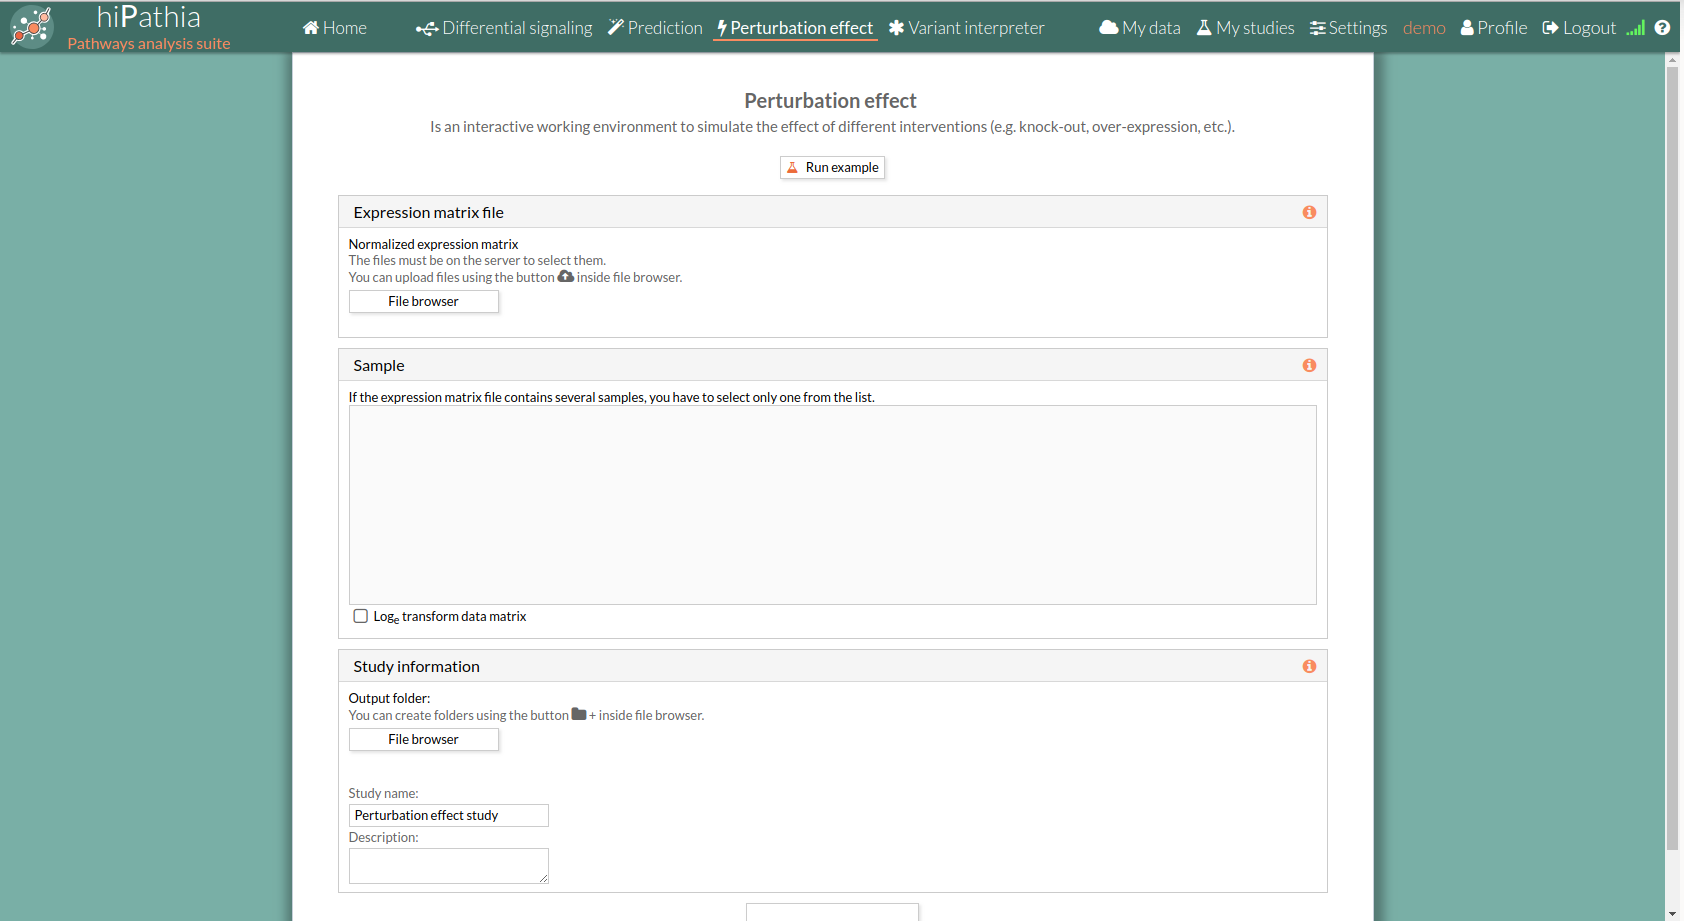
Perturbation effect form
The main page of the tool is a form. This form includes all the information and parameters needed to process a perturbation effect study.
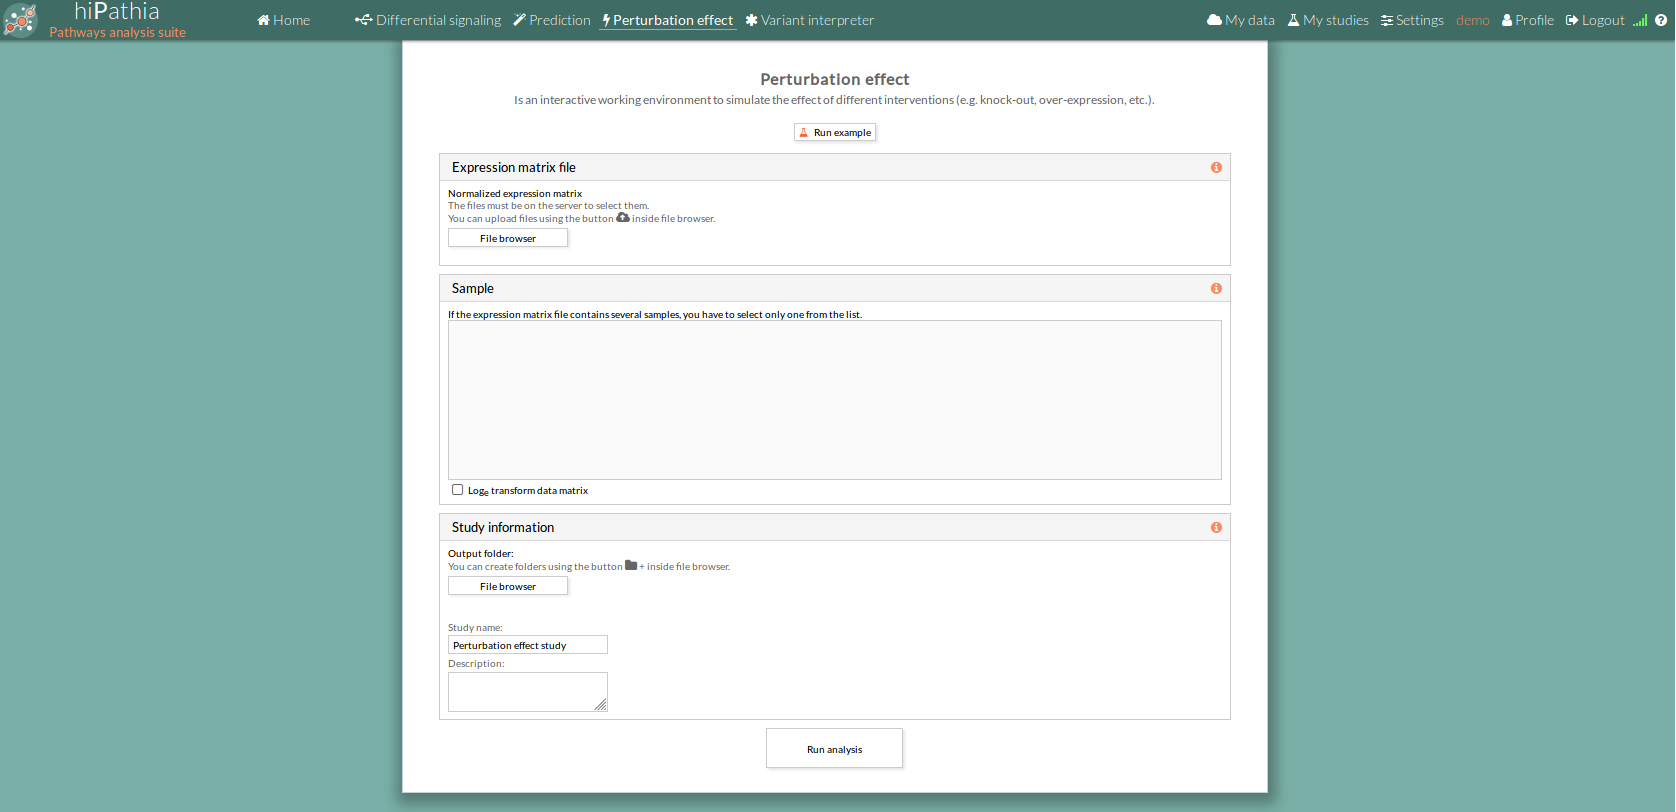 The form is divided in different panels:
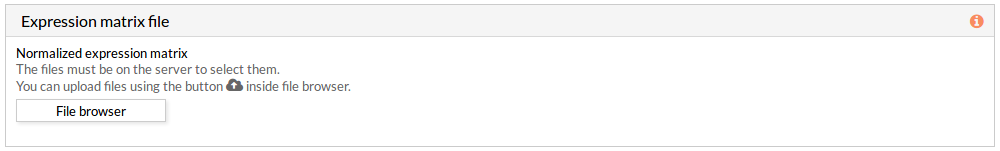
Expression matrix file
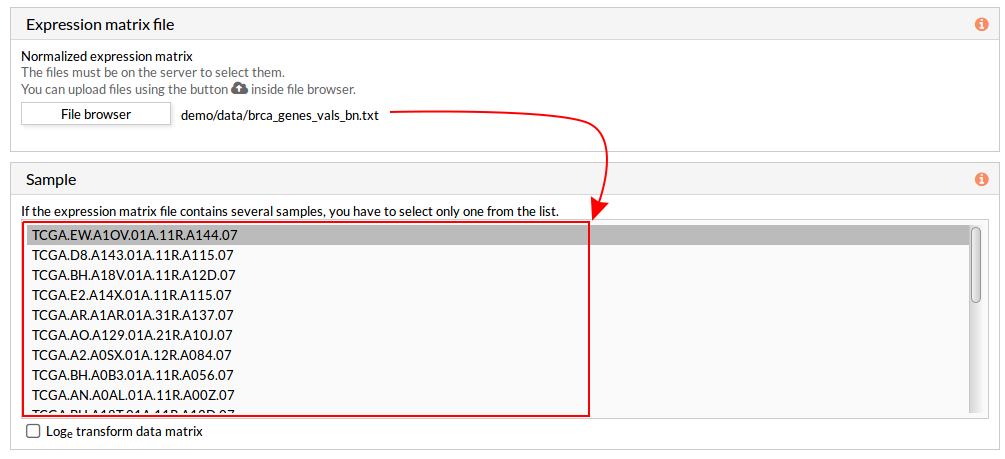
- Expression matrix file : Expression matrix provided by ourselves (see how to upload files in Upload your data).
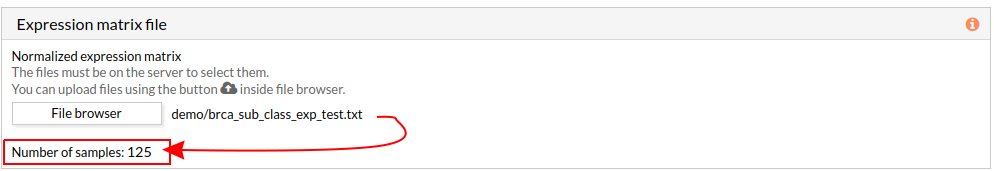
 When we select a gene expression file, the number of samples of this matrix will appear under the “File browser” button as shown below.
Sample
Once the file is selected the column names of the expression matrix will be loaded in this panel, we have to select the column to proceed.
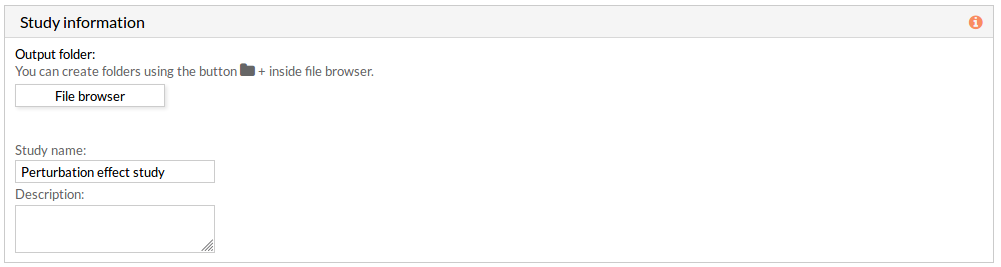
Study information
This panel includes some parameters in order to identify and save our study.
- Output folder: If we want to reorganize our studies we can select the folder in which we want save our report. By default the study will be saved in the home in a folder named “Perturbation_effect_study-N”, N is an integer number.
- Study name: We can give a name to our study. This is very useful to later identify it among the other studies listed in the My studies list.
The default study name is “Perturbation_effect_study-N”, N is an integer number. - Description: We can give a description to our study.
Run analysis
Once the form has been filled in, press the Run analysis button to launch the study. Your study will be listed in the My studies panel.
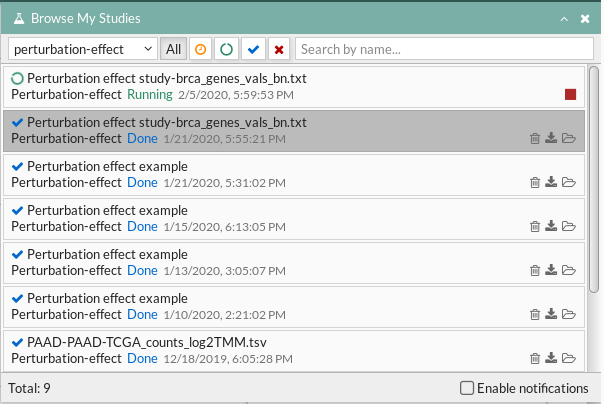
 Your study will be listed in the My studies panel, and a panel called Browse my studies will appear showing all your studies and their state. the new study will appear with a queued state then running state. If everything goes well, the state will be done after few minutes(depending on the inputs data and the availability of server).
All study states are:
Your study will be listed in the My studies panel, and a panel called Browse my studies will appear showing all your studies and their state. the new study will appear with a queued state then running state. If everything goes well, the state will be done after few minutes(depending on the inputs data and the availability of server).
All study states are:
- Queued: The information has been processed and the study has been sent and waits to be processed.

- Running: The study is in progress, study can be cancelled using the stop button.

- Done: The study has ended and the results are available to visualize and download.
- Cancelled: The study was canceled before finishing.
- Error: Sometimes a study can stop returning a error message, you can report and contact us in order to help you to fix it.
Perturbation effect report
The results page of the Perturbation effect tool is an interactive working environment . You can simulate knock outs or over-expressions of one or several genes or the effect of a drug in the activity of signaling pathways.
 The interactive working environment is divided in different panels.
1. Tool buttons
- Update: When genes are selected, it will update the pathways with the selected expression.
- Clear: Removes all genes and updates the pathways with the initial values.
2. Pathway viewer
The pathway viewer panel (2) shows the scaffold of the different signaling pathways supported by the web tool. Nodes are colored with a level of intensity proportional to their expression. You can navigate through the pathways by selecting the desired pathway in the Pathway list panel (3).
The pathway viewer is an interactive window where you can select any gene of a pathway by clicking on it. A window will appear showing the level of expression that the selected gene has in the current sample. This value can be modified as desired inside the range [0,1].

The pathway viewer also shows the result of the experiment performed, by coloring the significant circuits in different colors. For further information in the interpretation of the results, see Perturbation effect results.
3. Pathway list panel
The pathway list panel (3) lists all the available pathways. You can visualize a particular pathway into the Pathway viewer panel (2) by clicking on the corresponding name into the pathway list.
4. Circuit list panel
The circuit list panel (4) lists all the available circuits included in the current selected pathway in the pathway list (3).
You can select any of these circuits in order to make it stand out among the others. By clicking again on the name of the selected circuit, all circuits will be highlighted again.
5. Add genes
The Add genes panel includes the Search genes window and the list of genes with modified expression.
- Update: Each time you press the button Update, a comparison between the signaling values of the pathways in the current sample and the signaling values resulting from the modification of the expression values in the current sample by the selected values is performed. The results of this comparison can be visualized in the Pathway viewer panel (see Perturbation effect results) and by pressing the Show report button.
- Search genes: You can also search the desired genes to be modified in this window.
- Modified genes list: List of the genes whose expression has been modified, together with the new value of their expression. In order to remove a gene from the list, press the x button next to its expression.
6. Gene related drugs
The related drug list panel (6) lists the drugs including as target any of the genes selected in Add genes (5). You can simulate the application of any of this drugs by checking their corresponding checkbox.
7. Add Drugs
The add drugs panel (7) allows to search and add drugs directly.
8. Genes affected by drugs
The genes affected by drugs (8) lists the genes whose expression is being modified by any of the selected drugs in the gene related drugs panel (6).
Further information on the kind of drug is also displayed in the list.
9. Show report button
The Show report button shows a new window with the report of the results for the current comparison(last update). This report includes two fields:
- Input: Lists the genes whose expression has been modified in the current comparison, the new expression value and the origin of modification; if is from drug or directly from the user.

- Circuit impact: Lists the names of the pathways, ordered by the absolute value of their fold change (also log(Fold_Change)). An absolute fold change greater than 2 is considered significant. Therefore, an absolute log fold change greater than log(2)= 0.6931472 is significant.

In order to close this window and return to the tool page, you can press the x button on the right upper side of the window or the Close button at the bottom of the panel. the report panel is movable.
10. Settings button
In this window you can configure the fold change threshold beyond a circuit is considered statistically significant.
Also can configure the effect of each type of drug by clicking on the Settings button.

11. Last update gene list
This panel shows the last update gene list with it's activity status. Last update gene list
Worked example and Interpretation of the results
You can find an example of the use of this tool and the interpretation of the results at Worked example: Perturbation effect.