
Table of Contents
Variant Interpreter
The Variant interpreter allows us to infer how a gene (or combination of genes) knockdown may deregulate the signaling pathways activity. This impact is evaluated by comparing the normal activity values from a given tissue, with the activity values of that same tissue calculated after the in silico knockdown of the expression values of the genes of interest.
This can be done for each signaling pathwat and for each one of the tissues included in GTEx. Additionally, the user can upload a file with gene expression data to perform the analysis on custom tissue.
Essentially, we are comparing pathway activities between two groups (Normal tissue Vs Knockdown tissue), to aid us in the functional interpretetion of disruptive genomic variants.
The tool can be accessed from the upper main menu bar, by clicking on the Variant interpreter button. See Workflow for further information.
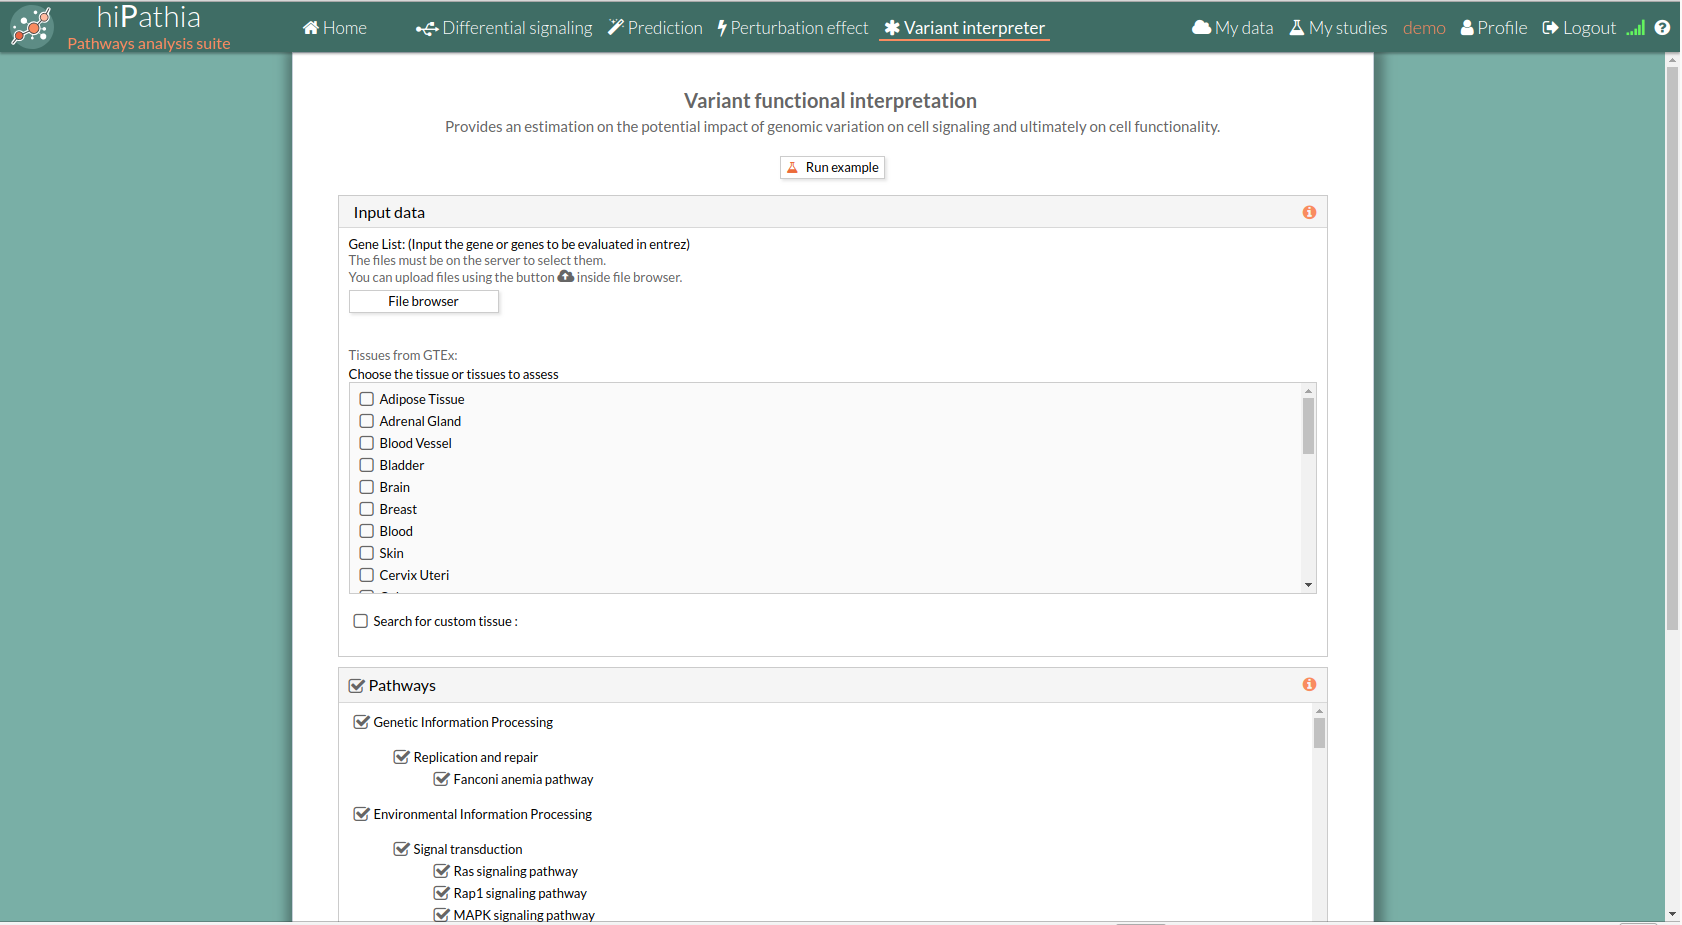
Variant interpreter form
The main page of the tool is its filling in form. This form includes all the information and parameters that the tool needs to carry out the analysis. The form is divided in different panels:
Input data panel
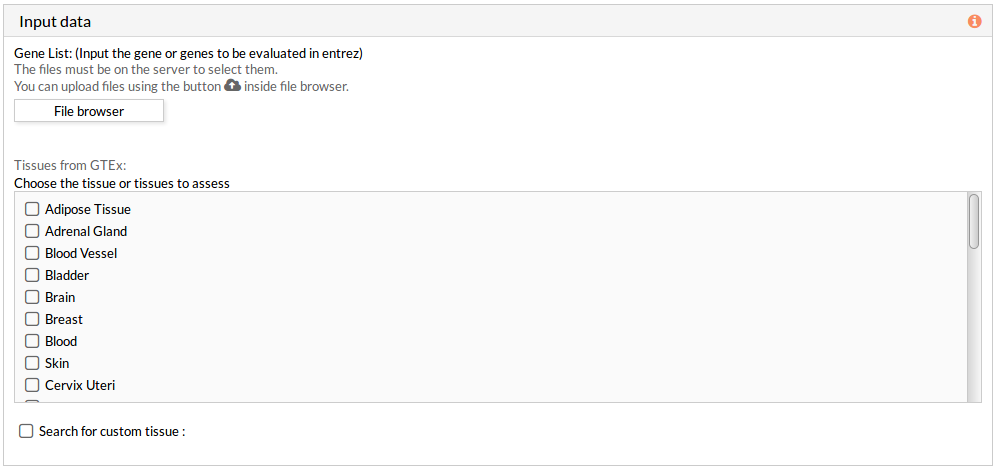 A tabulated text file with data on genomic variation must be uploaded. This file must include list of gene names in HUGO or entrez id (see gene list file format for more information).This genes list corresponds to the genes to in silico knockdown simultaneously.
Then you have to select at least one tissue, or a custom matrix file has to be loaded after checking the “Search for custom tissue” checkbox as shown below:
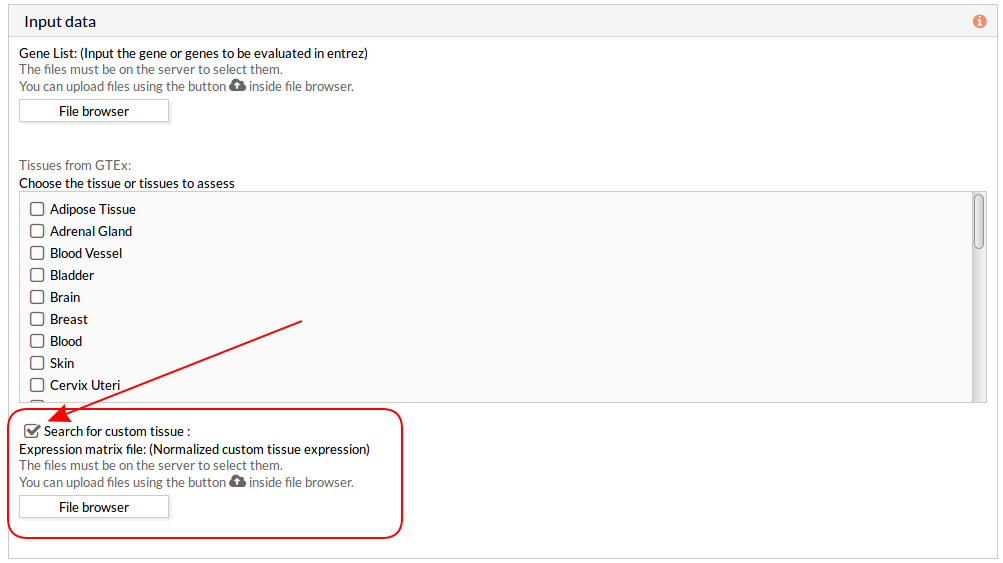 Note: You can select all options, but you have to take into account that the analysis will take more time depending on your custom tissue file, selected tissues and the server availability.
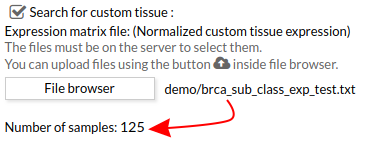
When you select the custom gene expression file, the number of samples of this matrix will appear under the “File browser” button as shown below.
Note: You can select all options, but you have to take into account that the analysis will take more time depending on your custom tissue file, selected tissues and the server availability.
When you select the custom gene expression file, the number of samples of this matrix will appear under the “File browser” button as shown below.
Pathways
This panel includes the list of all available pathways in HiPathia. We can select the pathways with which the analysis will be performed.
HiPathia retrieves pathway information from KEGG database. KEGG pathway database is a collection of manually drawn pathway maps representing the knowledge on the molecular interaction, reaction and relation networks.
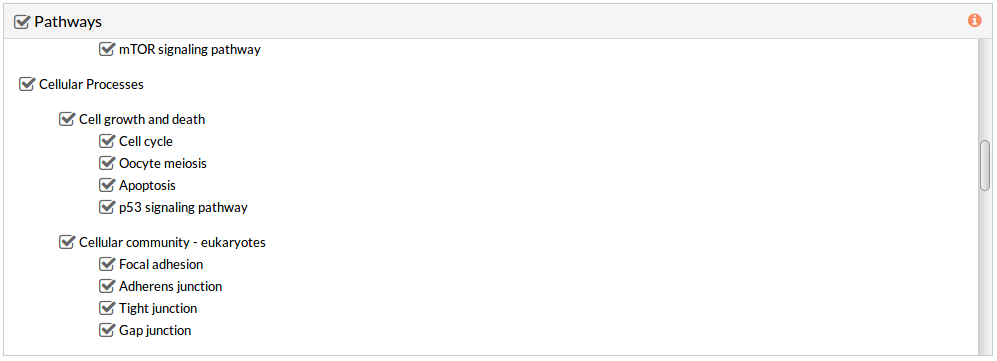 By default all available pathways are selected.
Note: At least one pathway has to be selected.
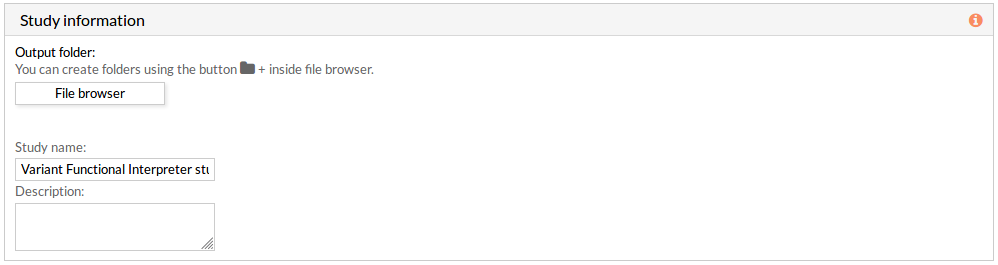
Study information
This panel includes some parameters in order to identify and save our study.
- Output folder: If we want to reorganize our studies we can select the folder in which we want save our report. By default the study will be saved in the home in a folder named “VaFI_study-N”, N is an integer number.
- Study name: We can give a name to our study. This is very useful to later identify it among the other studies listed in the My studies list.
The default study name is “VaFI_study-N”, N is an integer number. - Description: We can give a description to our study.
Run analysis
Once the form has been filled in, press the Run analysis button to launch the study.
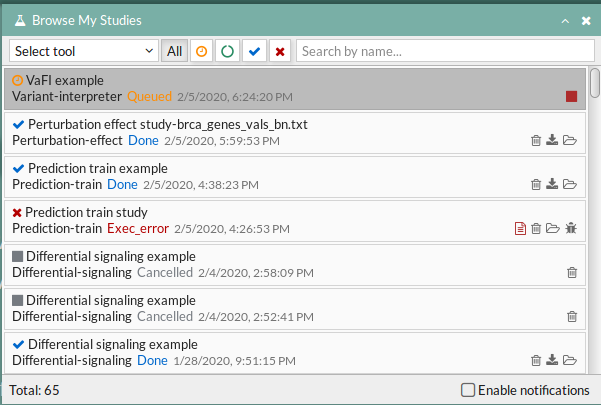
 Your study will be listed in the My studies panel, and a panel called Browse my studies will appear showing all your studies and their state. the new study will appear with a queued state then running state. If everything goes well, the state will be done after few minutes(depending on the inputs data and the availability of server).
All study states are:
Your study will be listed in the My studies panel, and a panel called Browse my studies will appear showing all your studies and their state. the new study will appear with a queued state then running state. If everything goes well, the state will be done after few minutes(depending on the inputs data and the availability of server).
All study states are:
- Queued: The information has been processed and the study has been sent and waits to be processed.
- Running: The study is in progress, study can be cancelled using the stop button.

- Done: The study has ended and the results are available to visualize and download.
- Cancelled: The study was canceled before finishing.
- Error: Sometimes a study can stop returning a error message, you can report and contact us in order to help you to fix it.
Variant interpreter report
The results page of the Variant Functional Interpreter tool is an interactive working environment. You can simulate knockdown of one or several genes in the activity of signaling pathways. Essentially, it is comparing pathway activities between two groups (Normal tissue Vs Knockdown tissue), also you can study the effect of a Knockdown for several tissues simultaneously and compare between them. This interactive working environment is divided in different panels:
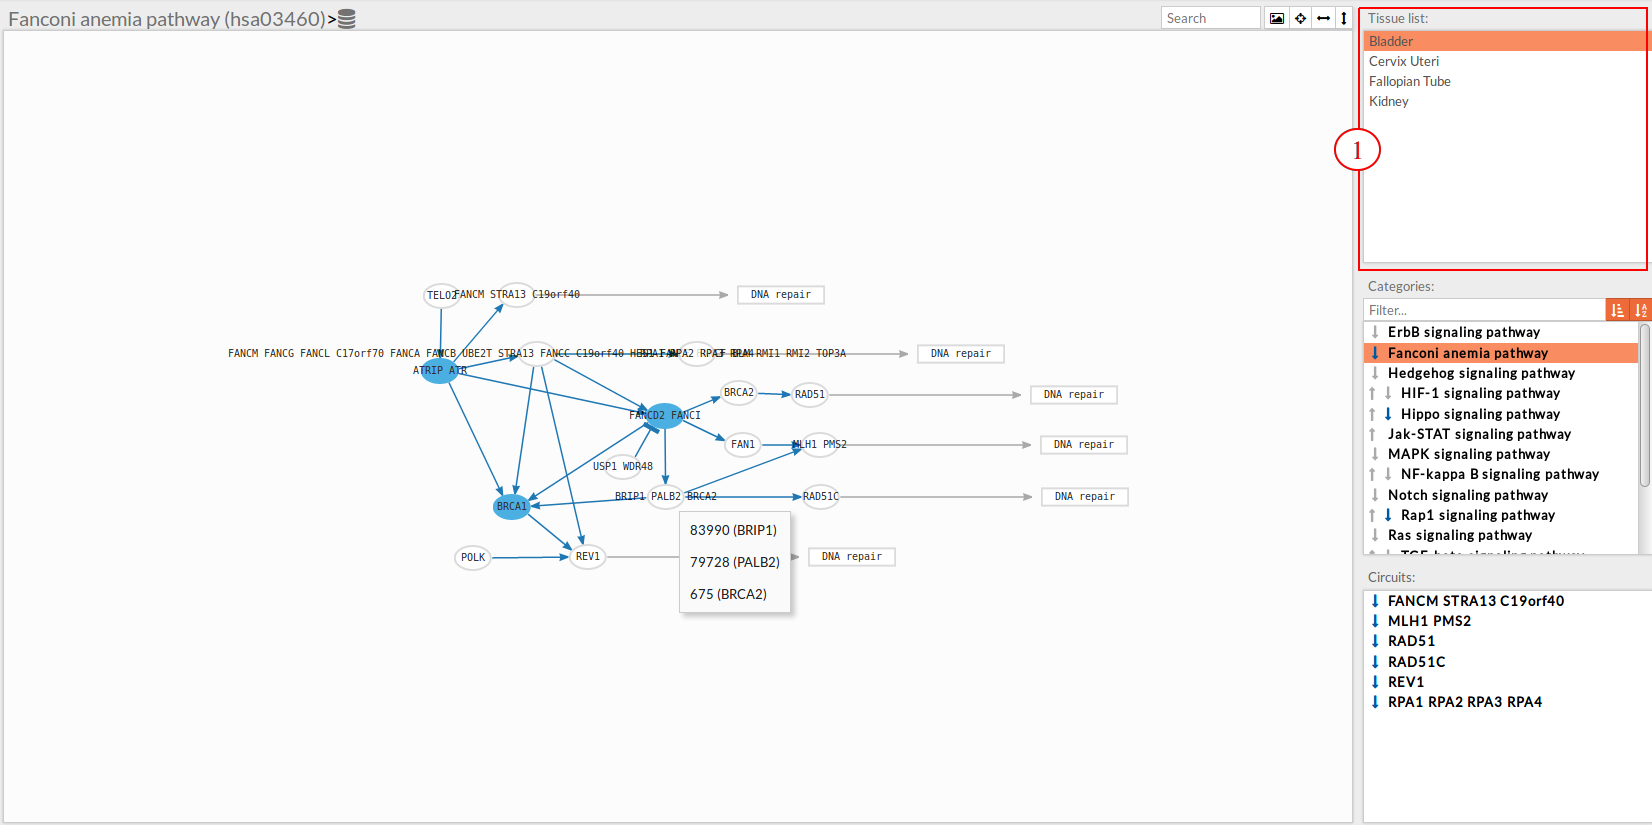
Tissue list
A list with selected tissues from GTEx. If the user uploaded a file with gene expression data a custom tissue will appear in this list under the name “Custom”.
Pathway list
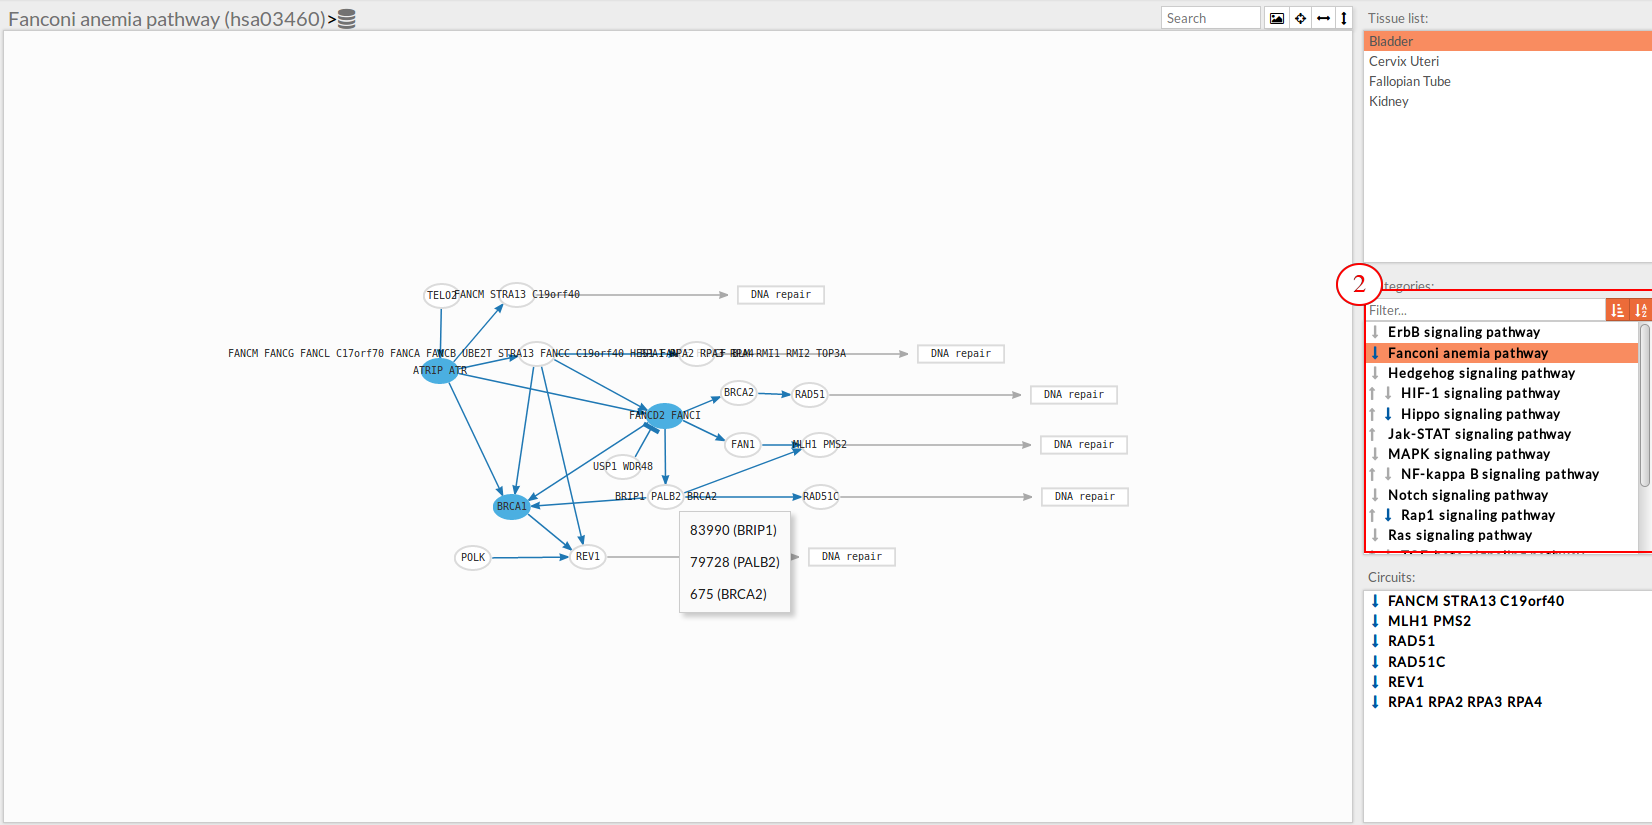
In this part of the visualization tool, all selected pathways from the variant interpreter form are shown along with one or two arrows. These arrows indicate whether in one of the “Effector circuit” within each pathway a differential activation pattern between the two compared groups (Normal tissue Vs Knockdown tissue).
The arrows will be colored if the differential activation is significant after the p-value adjustment (calculated from the circuit activity values using Wilcoxon test for paired data) and depicted in grey if it isn't.
The arrow will point up or down if an up-regulation or down-regulation of the signal occurs between the circuits within that pathway.
Only one arrow is shown if all the effector circuits are whether up or down-regulated.
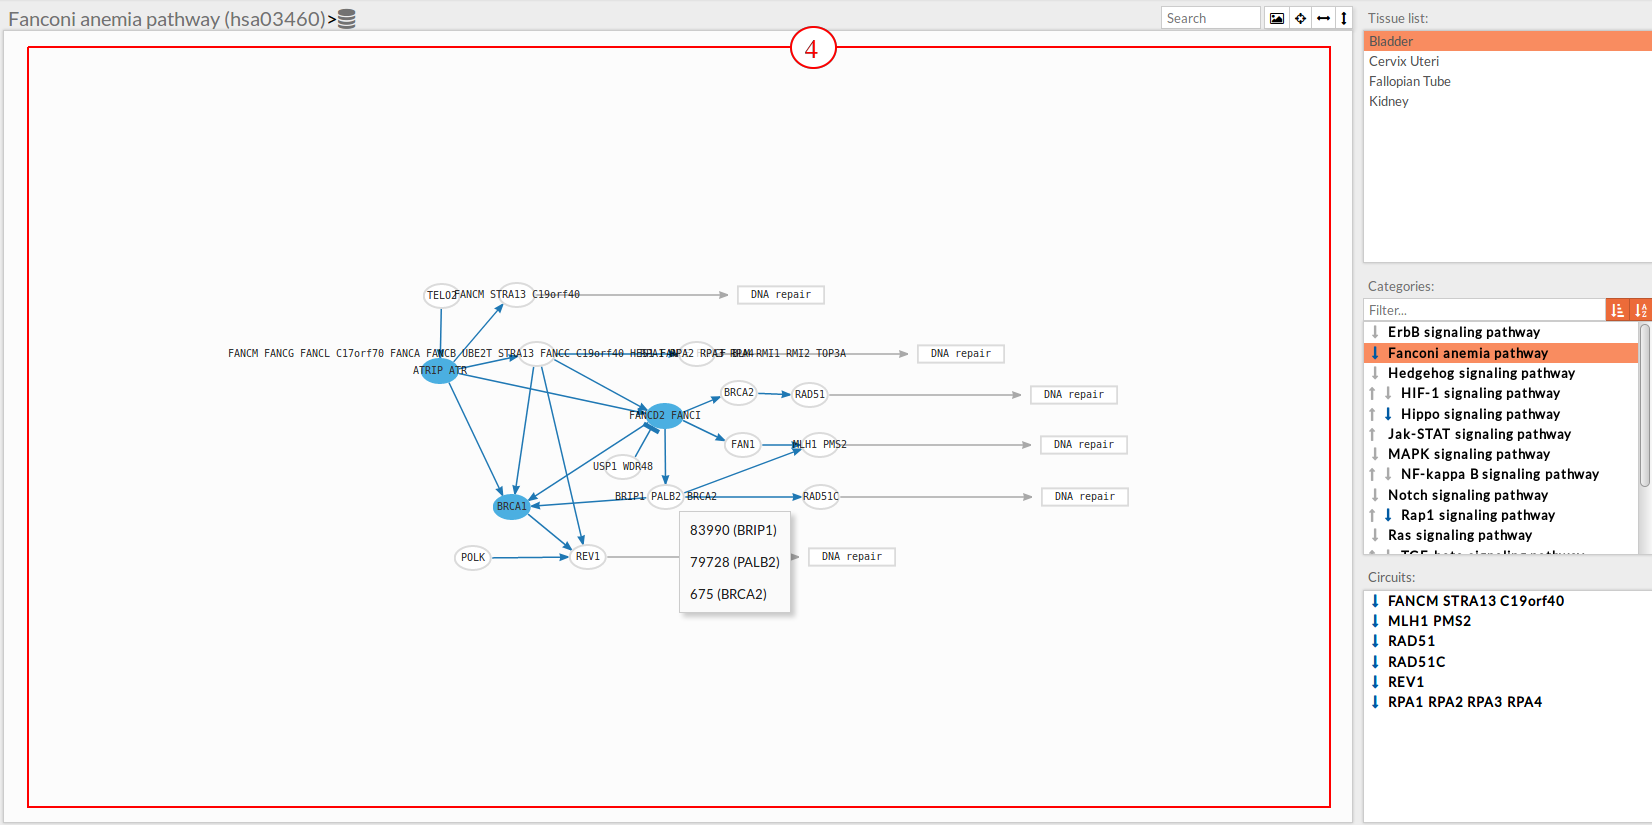
Circuits list
In the lower-right part of the tool will appear all the circuits in which a pathway (previously selected on the upper part -2-) can be decomposed.
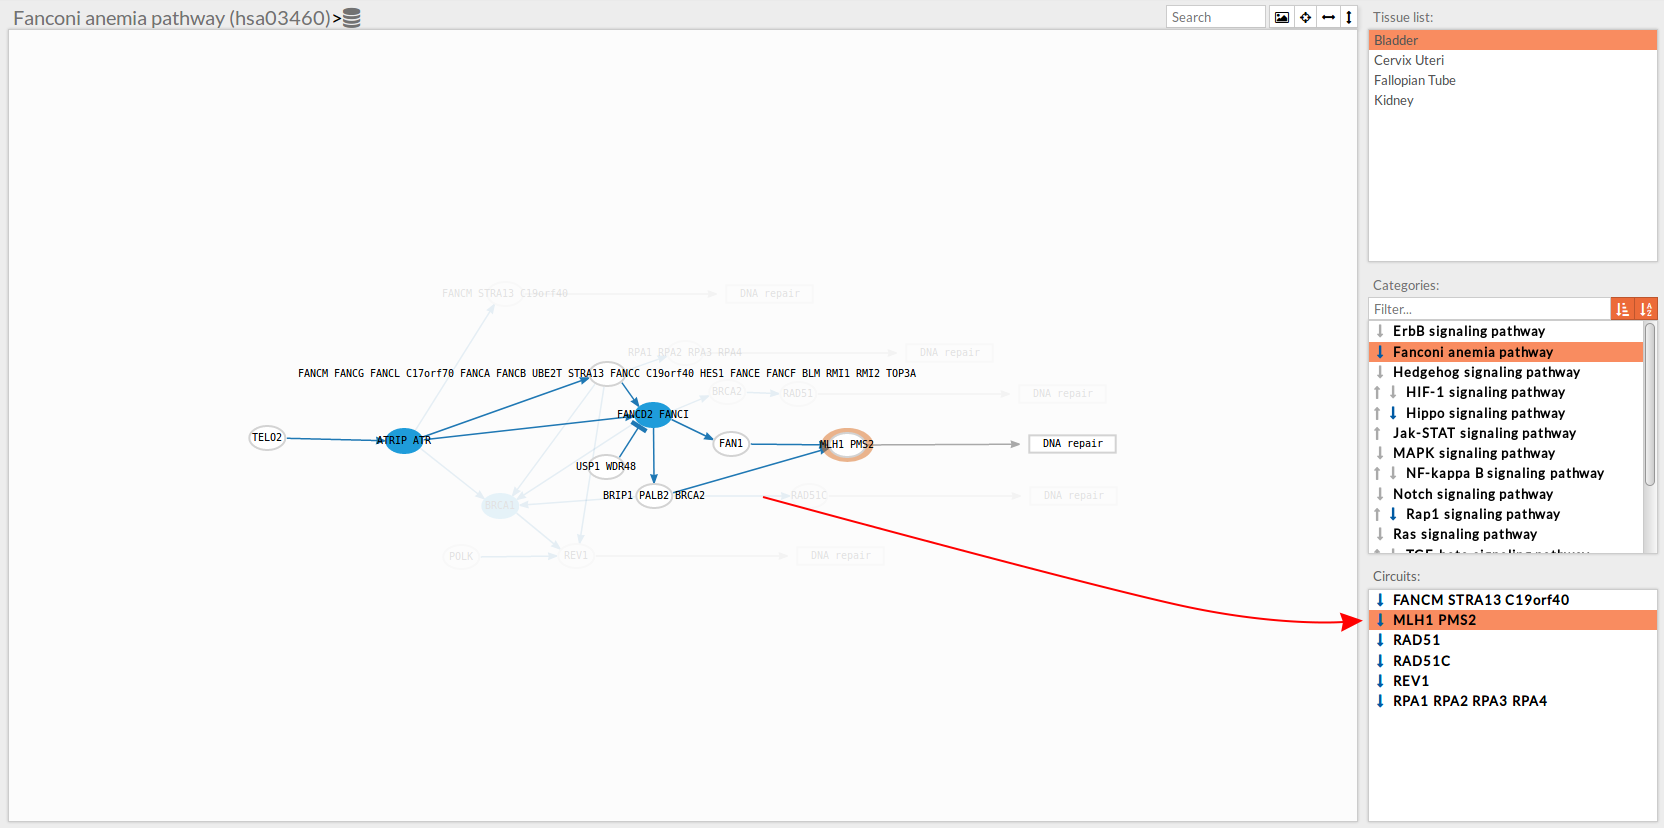
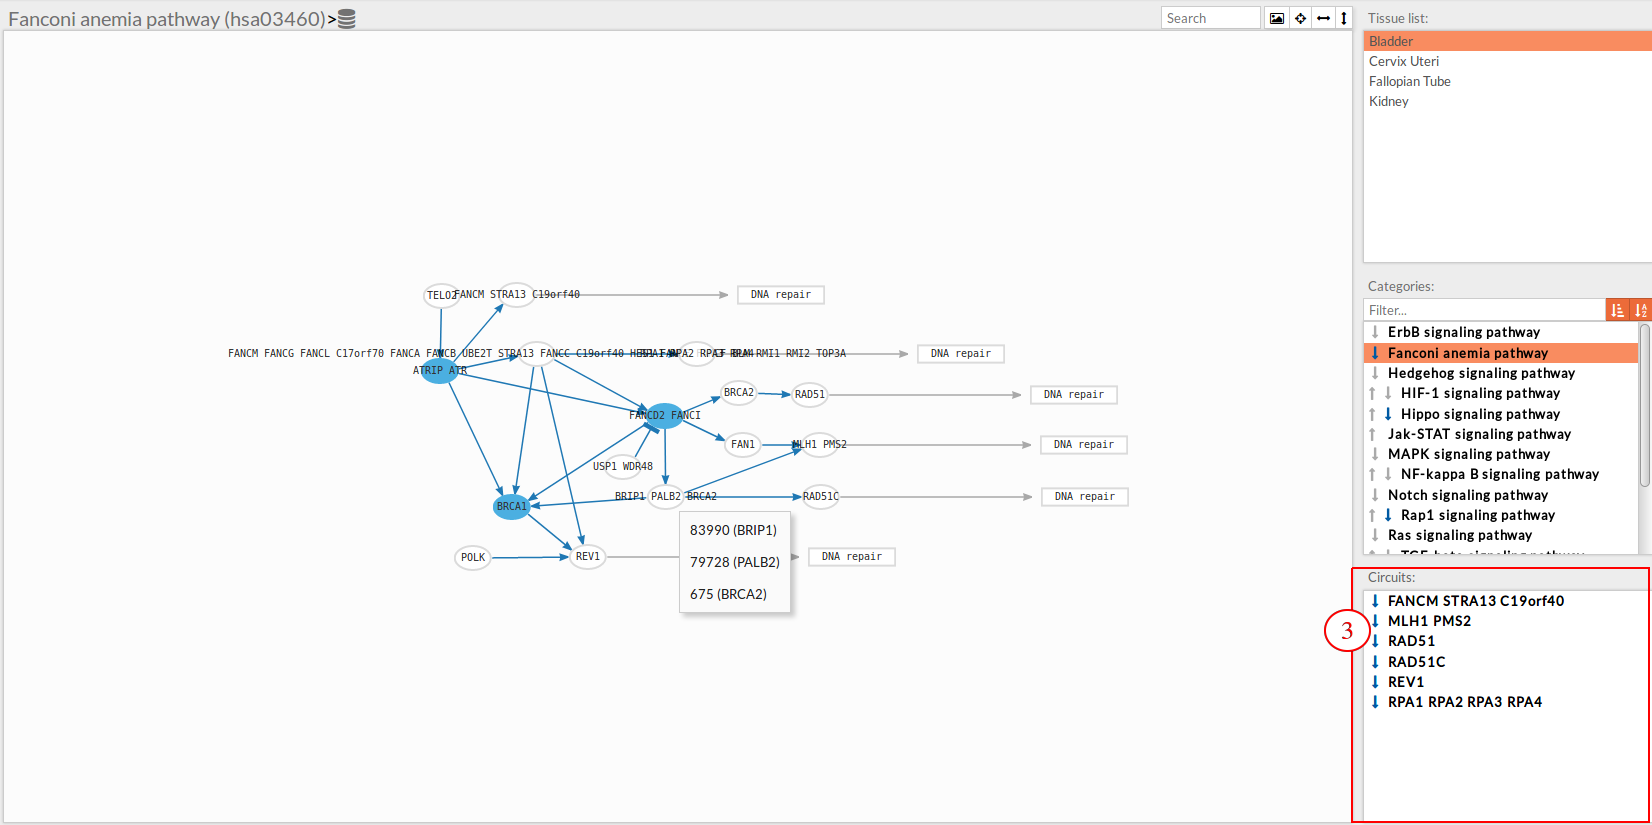 Once any of the circuit is clicked the nodes and interactions (edges) that form part of this circuit are highlighted in the pathway viewer, One example might be the blue-highlighted circuit on the figure below.
Visualization part
In the visualization part there are two types of objects, the nodes and the edges.
- The nodes represent the different proteins or metabolites that are responsible on passing the signal from the previous node to the next one. The nodes can be plain or complexes. In the former it is only necessary the presence of one protein (although that same function can be done by several proteins), while in the complex ones it is necessary the presence of two or more proteins to pass the signal through.
The color on the nodes are the result of a differential expression analysis on the gene/s involved on performing that node's function.
Note: In this tool, you will see just the blue color, because of the effect of the in silico knockdown of the expression values of the genes of interest. - The edges represent how the interactions between the different nodes are.
If the edge is an arrow then the previous node will be activating the next one, while if it ends with a vertical bar is the former node will inhibit the functionality of the following node. This interactions may be depicted in red or blue depending on the circuit they form part of (whether they are up-regulated or down-regulated). It may occur, that two or even three colors for a same edge are shown, but this only happens when a circuit is not yet selected on the lower-right part of the tool.
Once an certain circuit is selected all its edges will be colored in the same color depending on the result of the differential signaling activation analysis between the Normal tissue Vs Knockdown tissue.
Pathway viewer header
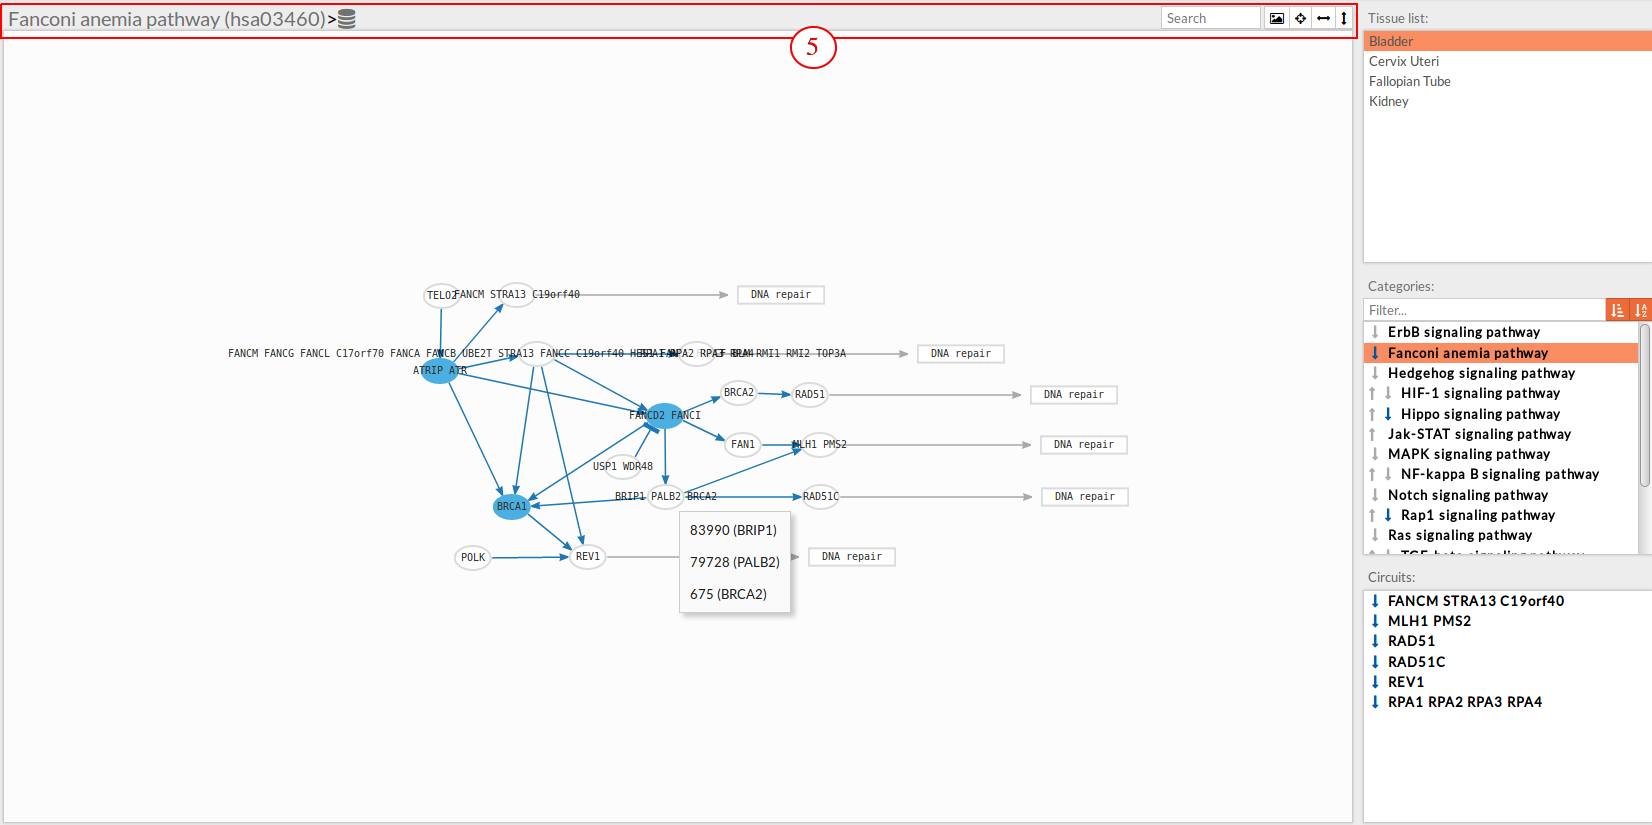 The top part contains the title of selected pathway,by clicking on this button
  you can see the original source of this pathway.
Also you can find other button in the right side:
you can see the original source of this pathway.
Also you can find other button in the right side:
 Allow to search specific genes, proteins or functions.
 Export a SVG image of viewed objects (the whole pathway or just the selected effector circuit)
 Center the selected pathway
 Width adjust
  Height adjust
The Hipathia web version 1.7.2
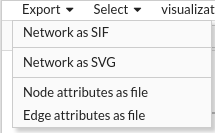
In this version, we have added new options to the pathway viewer as shown in the following image:

- Export: you can export the selected pathway as a SIF or SVG image, also you can export the node and the attributes files.
- Select: you can select by nodes or edges using specific filters and conditions, in the following video you will find an example of looking for the Entrez id “6494” in the gene lists of the selected pathway:
you can also select all nodes, first neighbourhood nodes or Invert node selection…as well as edges, or even select everything showed in the pathway viewer.
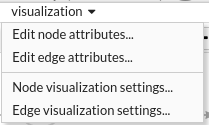
- Visualization: Sometimes we need to export the result, as an image for example, but with personalized details such as colors, sizes, or shapes… you can change its before exporting your personalized layout for further uses.
- Save layout: when you want to keep your actual layout for next use, you can click the save layout
 button and it will be saved in your session/study folder.
 - Change the color of the background: you can also change the color of the background as is shown in the followed tutorial