
Table of Contents
Worked example Differential signaling
The oestrogen receptor (ER+) positive group Vs negative group (ER-)
Differential signaling inputs
Note: You can also launch the Differential signaling example by clicking the Run example button or the help button on the header and then Differential signaling example.
1- Log into HiPathia. For further information on this step visit logging in.
2- Collection of data. We will work with a Breast Cancer dataset from the repository The Cancer Genome Atlas (TCGA) Link to dataset.
More information on the proposed dataset is available here:
Before use in HiPathia, the dataset must be normalized. We recommend using the logarithm of the trimmed mean of M values (log2TMM).
We have randomly selected 178 samples of breast cancer tumors from the dataset, annotated as ER+ and ER-(the molecular annotations come from this paper). This tumor classification considers the presence or absence, respectively, of estrogen receptors in tumor cells. The goal of this study would be to learn how different these cancer subtypes are at the signaling level, and what processes are differentially active between them.
The expression matrix and the experimental design can be downloaded from these links:
- Expression matrix: brca_data_example_ERposneg.tsv
- Experimental design:brca_designmatrix_ERposneg.tsv
3- Upload the normalized data to HiPathia by clicking My data in the data panel, or click the run example button. For further information on this step visit Upload your data.
4- Click Differential signaling button.

5- In the Input data panel, click the File browser button of the section Expression matrix and select the desired normalized expression file.

As mentioned before, the number of samples is 356 (178 ER+ and 178 ER-), and this information appears after selecting the expression matrix file:

6- In the Design data panel, select Two group comparison. Click File browser in the Experimental design section, and select the desired file.

Automatically, Condition 1 and Condition 2 files are selected. Change Condition 1 to “Negative” and Condition 2 to “Positive” for it tobe used as the reference condition.

7- Select Human (Homo sapiens) as species (default).

8- In Effector annotation source, check both the Gene ontology and Uniprot keywords boxes.
9- In the Pathways panel select all the pathways (all are selected by default).
10- In the Study information panel, click the File browser button and select the desired output folder. In this case we will use analysis_BRCA.

Give a name to the study, for example, “Differential signaling: Er+ Vs Er-”.

11- Click the Run analysis button.

A study will be created and listed in the studies panel. You can access this panel by clicking the My studies button.

This a video tutorial for differential signaling study: ![]() :https://www.youtube.com/watch?v=ytyagfQpQPk&feature=youtu.be
:https://www.youtube.com/watch?v=ytyagfQpQPk&feature=youtu.be
Differential signaling results and interpretations
Once the analysis is finished at HiPathia web, the report/results will be available in “My studies”.
The results page of the Differential signaling tool includes different output results. You can download any table or image showed in the report page by clicking the name right before it.
You can also download the circuit activity values and function matrices by clicking Circuit values, GO terms values and Uniprot keywords values respectively.
For further information about the differential signaling report please visit Differential signaling results
Estrogen receptor (ER) pathway (hsa04915):
If we look at the estrogen receptor pathway, we can see it is mainly downregulated in ER-negative (ER-) tumors. Considering that ER- tumors are characterized by lacking estrogen receptors, these results are consistent with prior knowledge that the estrogen pathway is downregulated in tumors that are not sensitive to estrogen [1].
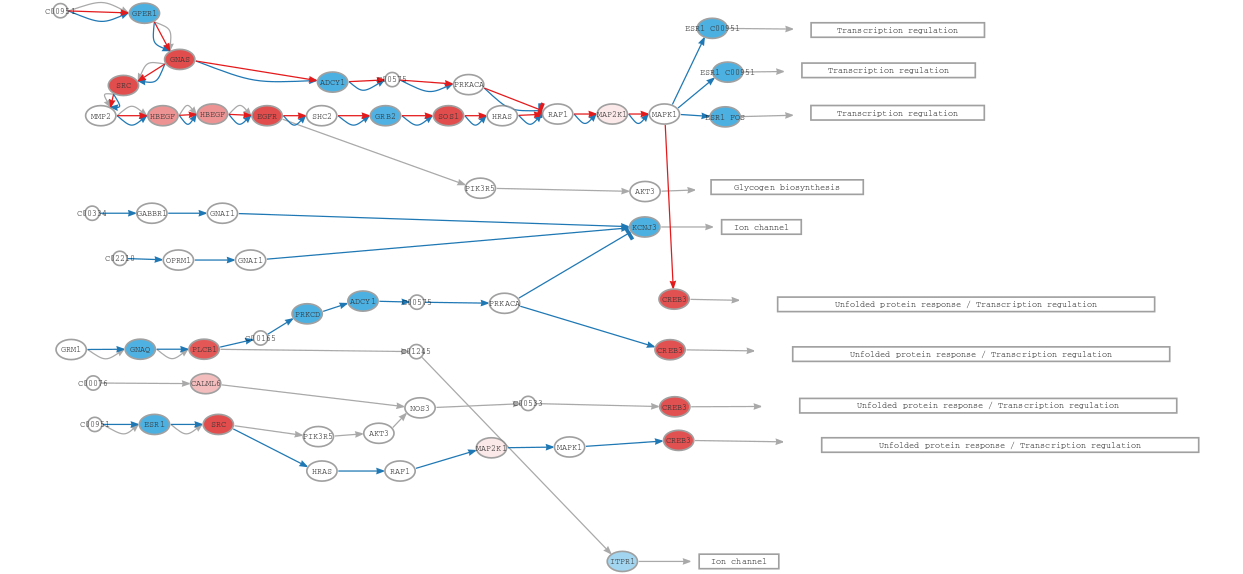
Despite gene expression being upregulated in ER- for CREB3, HiPathia shows its activity to be decreased according to the signaling cascade that activates it. The role of CREB3 in cancer progression and metastasis is controversial, being considered both a marker of good and bad prognosis, thus the interpretation of these findings might be tricky. The involvement of ER related CREB3 in breast cancer seems to be related to the activation of the transcription of other bad prognosis genes, such as CXCR4, ARF4, USO1, among others [2][3], thus the interpretation should be done along with the information of other pathways. Nevertheless, and despite the initial thought that ER- tumors will have all CREB3 circuits downregulated, in this Hipathia simulation we have found a mechanism that allows ER- cells to activate CREB3, and therefore, to putatively promote migration and metastasis, and that deserves further research.
Focal adhesion pathway (hsa04510):
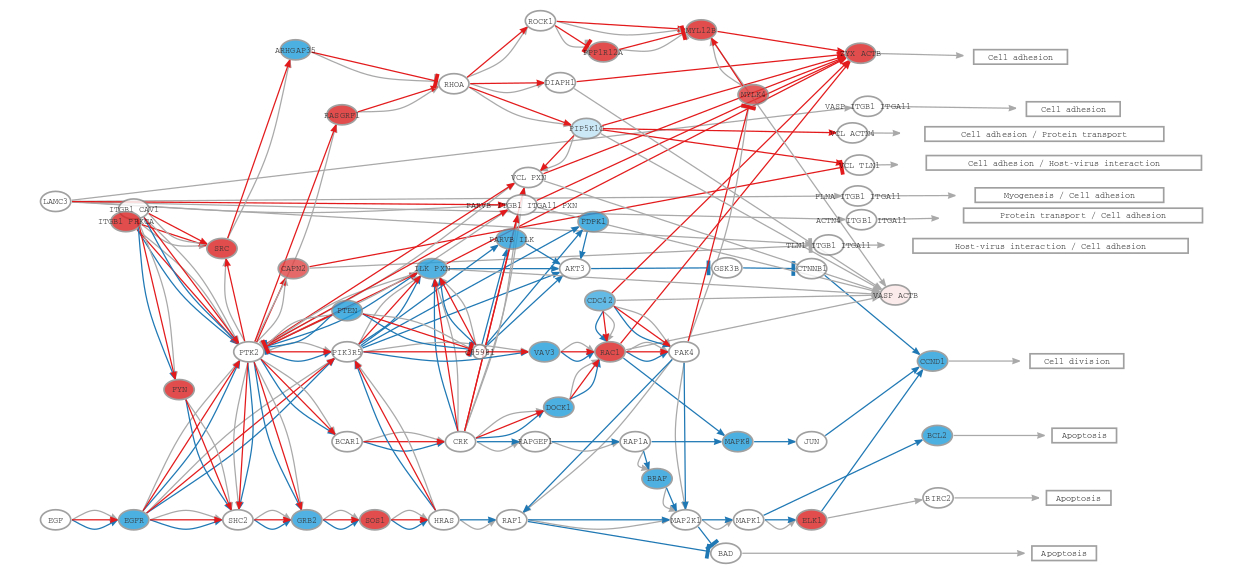
In the focal adhesion pathway, the activity of proteins involved in actin polymerization, such as actinin, vinculin, and zyxin, is upregulated in ER- tumors. Actin polymerization is involved in cell migration processes required for metastasis, which explains their upregulation given that ER- tumors are known to be more prone to migration and metastasis [4].
References
[1] Frasor J, Danes JM, Komm B, Chang KC, Lyttle CR, Katzenellenbogen BS. Profiling of estrogen up- and down-regulated gene expression in human breast cancer cells: insights into gene networks and pathways underlying estrogenic control of proliferation and cell phenotype. Endocrinology. 2003 Oct;144(10):4562-74. DOI: 10.1210/en.2003-0567. Epub 2003 Jul 10. PMID: 12959972.
[2] Howley, B. V., Link, L. A., Grelet, S., El-Sabban, M., & Howe, P. H. (2018). A CREB3-regulated ER-Golgi trafficking signature promotes metastatic progression in breast cancer. Oncogene, 37(10), 1308–1325. DOI: 10.1038/s41388-017-0023-0.
[3] Kim, HC., Choi, KC., Choi, HK. et al. HDAC3 selectively represses CREB3-mediated transcription and migration of metastatic breast cancer cells. Cell. Mol. Life Sci. 67, 3499–3510 (2010). DOI: 10.1007/s00018-010-0388-5.
[4] Padilla-Rodriguez, M., Parker, S.S., Adams, D.G. et al. The actin cytoskeletal architecture of estrogen receptor positive breast cancer cells suppresses invasion. Nat Commun 9, 2980 (2018). DOI: 10.1038/s41467-018-05367-2.