
Table of Contents
HiPathia, a mechanistic model of signaling pathways
Mechanistic models offer a realistic framework to understand how signal transduction depends on changes in the expression of genes involved in signaling pathway circuits (see Hidalgo et al., 2017). Interestingly, cell signaling circuits trigger relevant cell functionalities (e.g., proliferation, cell death, metabolic changes, etc.), which virtually allows to estimate not only signaling activity profiles but also a cell functional activity profiles, from transcriptional profiles. Moreover, a mechanistic model allows predicting the effect of interventions (gene knock-outs, drugs, etc.) over a given sample, opening the door to multiple applications for research or therapeutic purposes.
Hipathia mechanism
HiPathia retrieves pathway information from KEGG database. KEGG pathway database is a collection of manually drawn pathway maps representing the knowledge on the molecular interaction, reaction and relation networks.
The purpose of a signalling pathway is to activate a cellular function carried out by an effector protein. This activation is given as a result of a cascade of protein interactions triggered by a stimulus captured by a receptor protein.
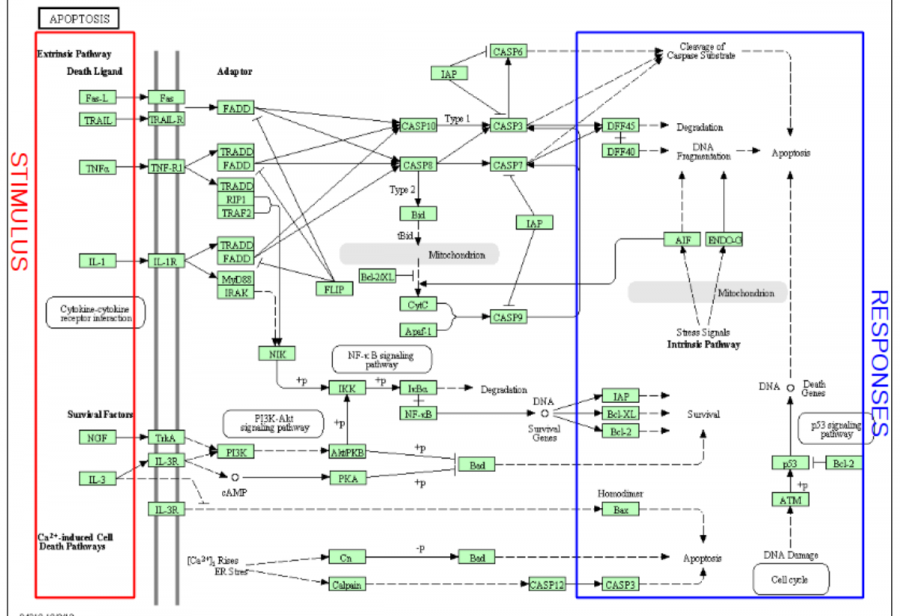 In Hipathia, the activation values for the different effector circuit within a signalling pathway are calculated separately. One example might be the red-highlighted circuit on the figure below. These method was chosen because of the fact that many pathways are multifunctional and often trigger opposite functions (e.g. depending the receptor and the effector proteins involved in the transduction of the signal, the apoptosis pathway may trigger survival or cell death).
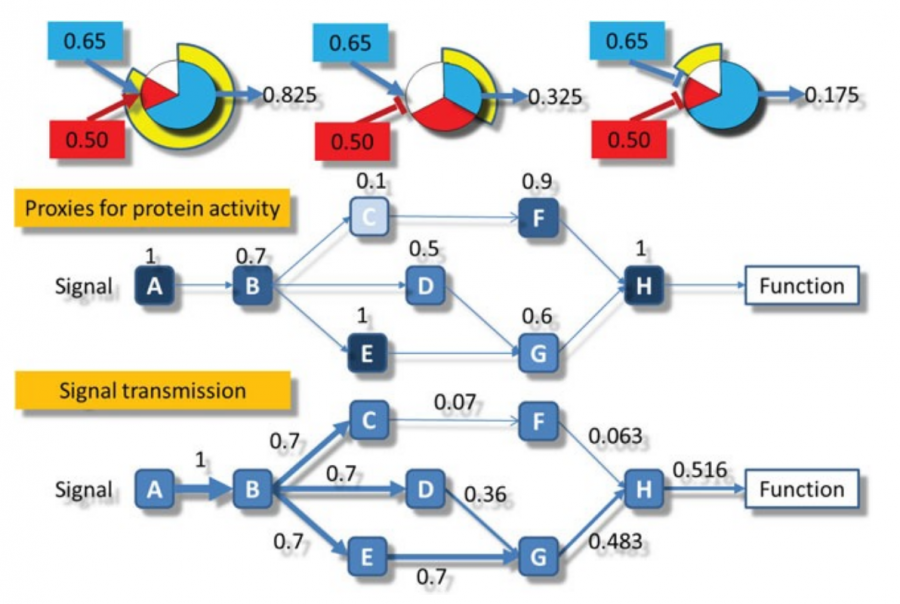
 Once an “effector circuit” topology is known, Hipathia uses gene expression values as proxies of protein presence values, and consequently of potential protein activation values. Two types of nodes can be found: plain nodes and complex nodes. The first ones, are nodes which function (passing the signal form the previous node to the next one) is carried out by only one protein. However the functions of these nodes may be accomplished by more than one protein. In such case the node value is summarized as the percentile 90 of the values of the proteins contained in it. On the complex nodes, it is necessary the presence of more than one protein to pass the signal through. The minimum value of the proteins contained (the limiting component of the complex), is taken as the node activity value.
In order to calculate the circuit signal, once the node activity values have been estimated, we assume an incoming signal value of 1 in the input nodes (stimuli-receptor proteins) of any circuit. Then, the signal is propagated to the following nodes as shown in the image above until it reaches its effector node. This is going to be the values that will be taken as the activation value for each “effector circuit”.
 Finally, Hipathia also calculates the activation state of some molecular functions by looking at the functions annotated for the effector proteins in which the “effector circuit” finishes. With Hipathia's method it is possible to obtain an individual activation value of the different functions for each. Therefore it's also possible to infer which functions have different activation levels in the groups that are being compared. This feature is implemented for the annotations of the Uniprot database and Gene Ontology.
This video present a simple simulation of how Hipathia model calculates the propagated signal throw a signaling circuit:
HiPathia modules
The HiPathia web server integrates four different pathway analysis modules:
- Differential signaling
- Prediction
- Perturbation effect
- Variant interpreter

Differential signaling
This module provides an estimation of the significant cell signaling activity changes across different conditions. To achieve so, signal value activities are estimated for each signaling circuit for the studied samples. Then, these signaling activity profiles can be compared according to the experimental design of the used dataset:
- Two group comparison, to check which signaling circuits present a significant change among the two compared groups, for example Tumor vs Normal.
- Correlation with continuous variable (e.g., the level of a metabolite, etc.), providing a correlation of each signaling path with this variable.
See the Differential signaling tool.
Prediction
HiPathia allows you to train, download and test a prediction model for your dataset. The machine learning module can be trained either to:
- Discriminate between two different groups of samples
- Predict the value of an unknown variable.
In order to check how to use these tool please see Prediction.
Perturbation effect
This module offers an interactive working environment to simulate the effect of different interventions (e.g. knock-out, over-expression, etc.) over the activity of signaling circuits in the pathways, as well as their potential functional consequences in the cell. Given a specific condition, corresponding to a specific gene expression profile, knock-outs, knock-downs or different types of inhibitions are simulated by reducing or setting to 0 the expression level of the gene or interest. Conversely, over-expressions or agonistic interventions can be simulated by increasing its gene expression level. Then, the new condition with the simulated interventions is compared to the original one and the circuits affected are reported. In this way a holistic view of the ultimate effects across all the signaling pathways can be obtained. The simulation of the intervention can be carried out in different ways:
- Over one or several genes,
- Simulating the effect of one or several drugs, by simulating the effect of the drug on the corresponding genes targeted,
- A combination of the two previous scenarios.
See more about the Perturbation effect tool.
Variant interpreter
This tool provides an estimation of the potential impact of genomic variation over cell signaling and consequently on cell functionality. The tool predicts the possible effect that gene disruptions produced by LoF (Loss of Function) variants can have over signaling circuits as well as the cellular functions triggered by them. This module of HiPathia mechanistic model would be a specific case of the perturbation effect analysis, allowing the possibility of visualizing the effects of such perturbation for several tissues separately. also in this tool, the estimation can be done for more than one sample. A knock-down simulation is carried out on genes harboring LoF variants in a condition that represent a normal tissue. Then a differential signaling analysis is carried out by comparing the condition with the simulated KOs with the normal condition. Normal conditions are taken from the repository of gene expression profiles of normal tissues available in the GTEx database or, alternatively, a gene expression profile can be provided by the user (custom tissue). Then, the signaling circuits potentially deregulated by the disruption of the gene/s provided by the user are detected and visualized.
See the Variant interpreter tool.