
This is an old revision of the document!
Table of Contents
Worked example: Perturbation effect
In silico simulations of the functional effects that drug-induced perturbations would have in the cell are extremely valuable to predict putative therapeutic impacts of drugs or combinations of them. They are also useful to evaluate response inconsistencies and to search for resistance mechanisms. To demonstrate the value of this tool, this example will be focused on the functional impact that the combined inhibition of EGFR and c-Raf (RAF1) would have on a pancreatic tumor. To do so, we simulated the effect of erlotinib (a known and widely used anti-EGFR drug) in combination with the knockdown of the RAF1 gene. This combination has been described to achieve a complete regression of pancreatic cancer in ductal adenocarcinoma derived xenografts induced by KRAS mutation [1].
The simulation is carried out by modifying the expression level of the targeted genes. The tool uses the functionality of the PathAct algorithm in the HiPathia application.
Step by step
To reproduce this example, click the Perturbation effect example under the help button.

You can also launch a new study by following these steps:
- Log into Hipathia. Click the login button on the top right corner to open the login panel. You can also log in using an anonymous user. Please visit Logging in for further information on this step.

- Click the Perturbation effect tool in the menu to open the empty form.
- Click the Run example button. Alternatively, you can also upload your own gene expression file.

- A study will appear on the My studies panel and will be processed.

- Once finished (Done), click the study name to open the view window.

- The view window will open.

- In the add genes panel, you can search for genes to target and manually change their expression. You can also search for specific drugs to simulate in the Add drugs panel. The tool also displays a list of drugs that target any of the genes selected. To remove an effect, simply click the “X” to its right and the expression levels of the affected genes will return to their original value after clicking the Update button.
- Search “RAF1” in the add gene box and add it.
- Search “erlotinib” in the add drug box and tick the box to its right. The box with the targeted genes will look like this:
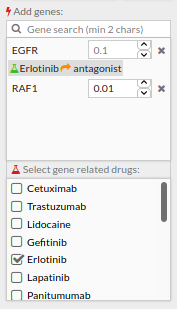
- Remember to click Update to apply all changes.
You will notice that the nodes with a thick red outline (as shown in the screenshot below) contain at least one of the knocked-down genes, and those with a thick green outline contain some gene affected by an applied drug. Further, if we open the node attributes table, we can see how erlotinib (which acts as an antagonist) has decreased the activity of EGFR (the exp column in the node attributes table) by a multiplier of 0.1 with respect to its original value (the exp_values column).
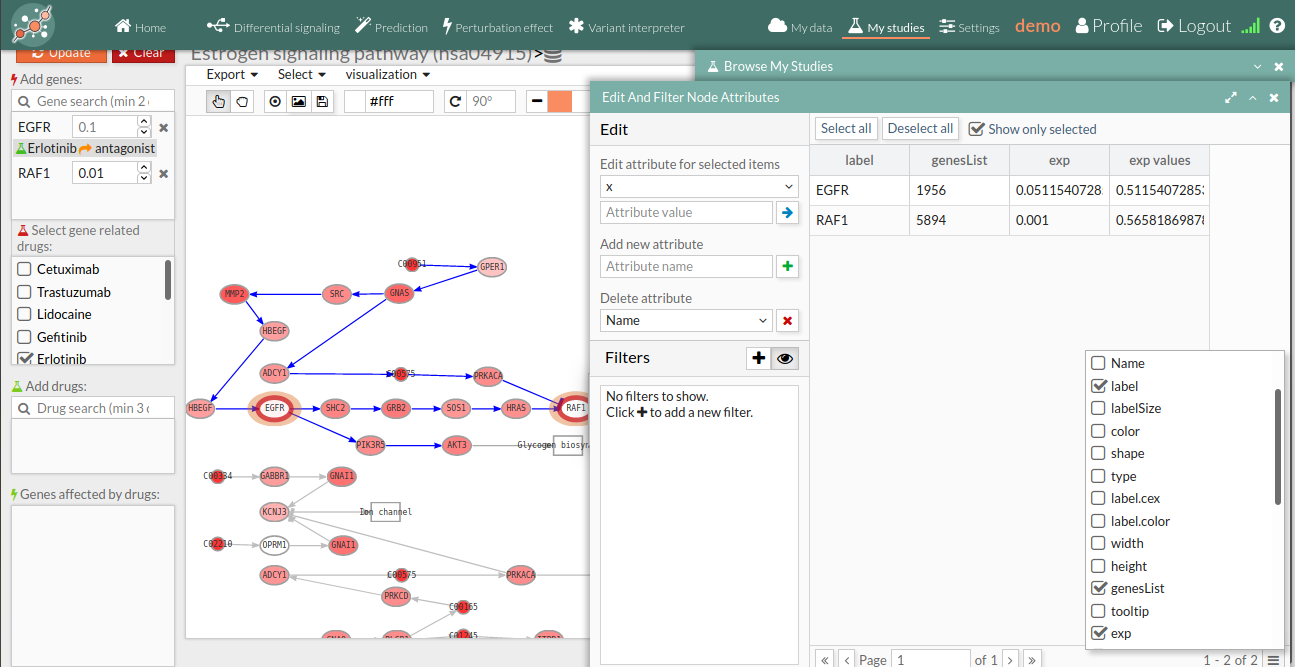
- Gene perturbations can be studied individually or in combination. This makes it possible to check for potential effects of drug combinations over the activity of signaling pathways.
Results and interpretation
The Perturbation effect tool reproduces the effect of the knock-down or over-expression of a set of genes by comparing the signaling profile of the pathways in the uploaded sample and the signaling values resulting from the modification of the expression values in the current sample by the selected values.
Each time the Update button on the Gene list panel is pressed, a comparison is performed with the modifications present in the Gene list and the Additional drug targets.
Pathways with signaling differences are depicted in bold characters in the Pathway list panel “Categories panel”. The up and down arrows indicate that there exist up and down-regulated circuits in the corresponding pathways, respectively. When the up arrow is red or the down arrow is blue, the differences are significant. An absolute fold change greater than 2 is considered significant. Therefore, an absolute log fold change greater than log(2)= 0.6931472 is considered significant.

Circuits with signaling differences are depicted in bold characters in the Circuit list panel. The up and down arrows indicate that the circuit is up or down-regulated, respectively. When the up arrow is red or the down arrow is blue, the differences are significant.

Results can be also visualized graphically in the Pathway viewer. Each time a pathway is selected in the Pathway List it is displayed in the Pathway viewer. The edges of the circuits with a difference in their activation are depicted in different colors.
- Light greyish red: The circuit is up-regulated, but not significantly.
- Light greyish blue: The circuit is down-regulated, but not significantly.
- Red: The circuit is significantly up-regulated.
- Blue: The circuit is significantly down-regulated.

The results can be exhaustively examined and downloaded from the report generated by pressing the Show report button. A new window with the report of the results for the current comparison is displayed. This report includes two fields:
- Input: Lists the genes whose expression has been modified in the current comparison, and the new expression value.
- Path impact: Lists the names of the pathways, ordered by the absolute value of their fold change (also log(Fold_Change)). An absolute fold change greater than 2 is considered significant. Therefore, an absolute log fold change greater than log(2)= 0.6931472 is significant.

To close this window and return to the tool page, you can press the close button on the right upper side of the window or the Close button at the bottom of the panel.
/* Visualize the results. For further information in the interpretation of the results, see [[Perturbation effect results|Perturbation effect results]].*/