
Table of Contents
Worked example Variant Interpreter
Example 1: Diabetes study
1- Log in into HiPathia. For further information on this step visit Logging in.
2- We will work with expression data from custom tissue related to Diabetes. In this case we will work with a gene expression dataset of human islets from 63 donors (54 non-diabetic and 9 type 2 diabetic). You can download the raw expression matrix used for this example from GEO repository, accession number GSE38642 You can read the original study here: https://pubmed.ncbi.nlm.nih.gov/22768844/
For the purpose of this example we will only use the data of the 54 non diabetic donors. The Variant interpreter tool allows to explore the functional consequences of the variation in the expression of a gene or a combination of genes. The aim of this example is to investigate the functional variations triggered by the knock out of the gene RAP1GAP, this gene is known to play a key role in inflammatory processes which are highly related to the development of type 2 diabetes mellitus.
Hipathia only takes as input normalized data, so you will have to correctly normalize the raw expression matrix to be uploaded.
- Custom tissue expression matrix after normalization: Diabetes expression matrix
3- Upload the data to HiPathia in the data panel by clicking on My data. For further information on this step visit Upload your data.
4- We will evaluate the impact of disrupting variants of RAP1GAP. In this example the gene list will contain just the RAP1GAP gene
Then we will need to upload it the same way we did to upload expression data. Both gene names and entrez ids are accepted. Select Gene list as data type.
5- Press the Variant Interpreter button.

6- In the Input data panel. Press the File browser and select the desired file for gene list and custom tissue expression file (OPTIONAL).

7- (OPTIONAL) Select a subset of signaling pathways to evaluate, all pathways are selected by default.

8- In the Study information panel, press the File browser button and select the desired output folder. In this case we will use Diabetes_KO_analysis. Give a name to the study, for example “Diabetes KO analysis”.
9- Press the Run analysis button. A study will be created and listed in the studies panel. You can access this panel by clicking on the My studies button.
Results and interpretation
When the analysis is finished at Hipathia web, the report/results will be available in “My studies” section once the study is done.
You can download any table or image showed in the report page by clicking on the name right before it.
You can also download the circuit activity values and function matrices by clicking on Circuit values, GO terms values and Uniprot keywords values respectively.
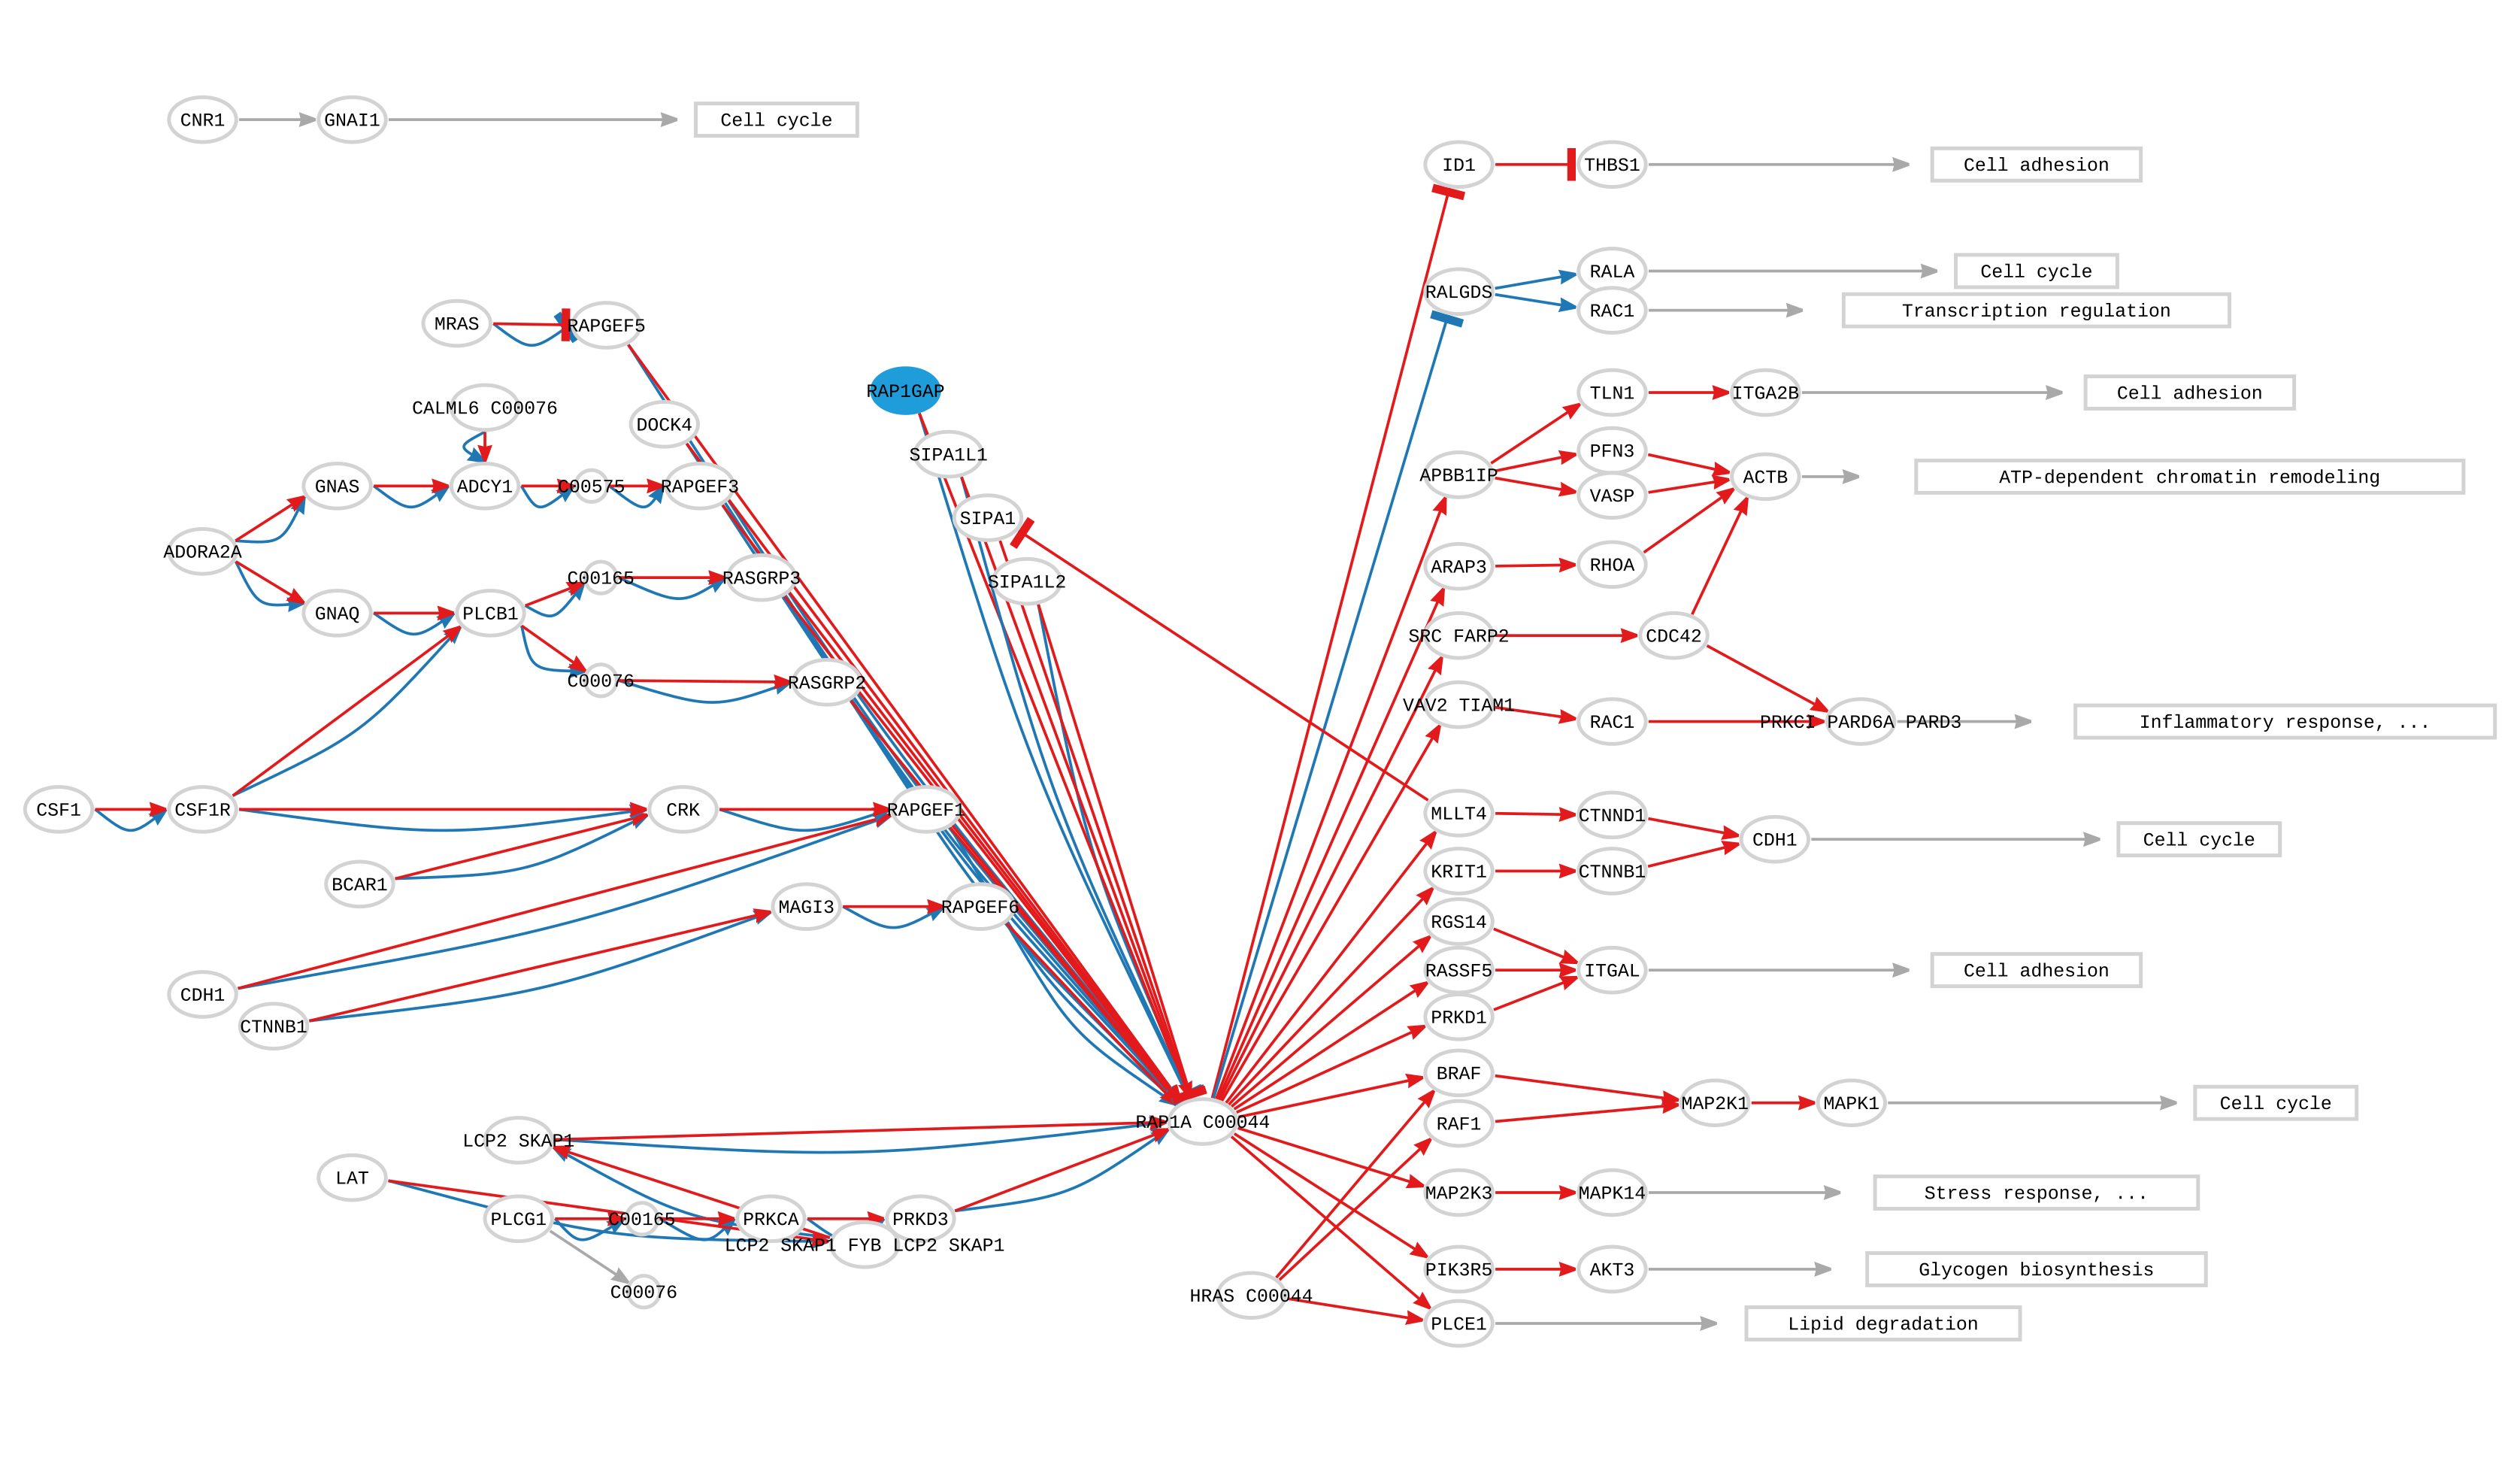
As we can see in the figure below, the results after the simulating the KO of gene RAP1GAP over the 54 non diabetic samples only show deregulation on the pathways where the gene RAP1GAP can be found. Since RAP1GAP is an inhibitor of the Rap1 pathway, mostly all the functions associated to the circuits that compose the pathway are UP-regulated. The functional consequences of the KO of RAP1GAP vary from UP-regulation of Inflammatory processes, Cell adhesion and Stress response among others. The results shown seem to indicate that RAP1GAP plays an important role in the control of these processes highly related to diabetes. Therefore, loss of function mutations in those genes inactivating RAP1 protein would most likely result in an over-activation of inflammatory response and thus, an increased risk of developing immune-mediated diabetes (Peña-Chilet et al., 2019).
Example 2: Fanconi Anemia study
1- Log in into HiPathia. For further information on this step visit Logging in.
2- We will work with expression data from custom tissue related to Fanconi Anemia (bone marrow derived cells). You can download the raw expression matrix used for this example from GEO repository, accession number GSE16334. You can read the original study here: Vanderwerf et al. TLR8-dependent TNF-(alpha) overexpression in Fanconi anemia group C cells. Blood. 2009 Dec 17;114(26):5290-8). Hipathia only takes as input normalized data, so you will have to correctly normalize the raw expression matrix to be uploaded.
- Custom tissue expression matrix after normalization: FA expression matrix
3- Upload the data to HiPathia in the data panel by clicking on My data. For further information on this step visit Upload your data.

4- We will evaluate the impact of disrupting variants in gene BRCA1 (Biallelic BRCA1 mutations are regarded either embryonically lethal or to cause Fanconi anemia (FA), a genomic instability syndrome characterized by bone marrow failure, developmental abnormalities, and cancer predisposition cita ). We need to upload the list of genes in txt format the same way we did to upload expression data. Both gene names and entrez ids are accepted. Select Gene list as data type.
5- Press the Variant Interpreter button.
6- In the Input data panel. Press the File browser and select the desired file for gene list and custom tissue expression file (OPTIONAL).
7- (OPTIONAL) Select one or more in the GTEx tissues list in order to compare between them.
8- (OPTIONAL) Select a subset of signaling pathways to evaluate, all pathways are selected by default.
9- In the Study information panel, press the File browser button and select the desired output folder. In this case we will use FA_KO_analysis. Give a name to the study, for example “FA KO analysis”.
 10- Press the Run analysis button. A study will be created and listed in the studies panel. You can access this panel by clicking on the My studies button.